
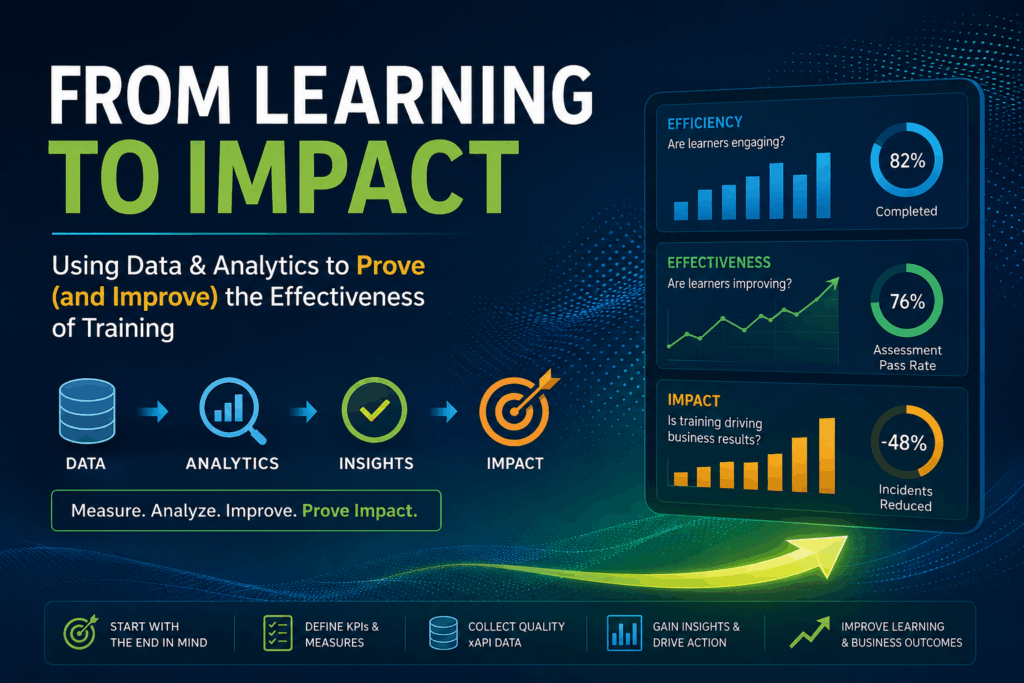
Last month, Veracity Technology Consultants‘ Jason Haag joined the xAPI Collective for a session on using data and analytics to prove – and improve – the effectiveness of training. It resonated strongly with our community, and the ideas are worth revisiting. A detailed write-up is now live on the Veracity blog, and it’s well worth your time.
Here are the key ideas we think every xAPI practitioner should take away.
Don’t Start With xAPI -Start With the Question
The central argument is deceptively simple: before you ask what xAPI statements to write, ask what you’re actually trying to prove or improve. What behaviour change are you targeting? What does success look like for stakeholders? What business outcome is this training meant to support?
It’s a mindset shift that many of us know we should make, but don’t always put into practice. xAPI gives us tremendous flexibility to capture learning and performance data – but more data isn’t automatically better data. Without an evaluation strategy behind it, data can quickly become noise.
Evaluation Belongs at the Beginning, Not the End
One of the sharpest observations in the post is about where evaluation sits in most L&D processes – too often, it’s treated as an afterthought rather than a design input.
The case is clear: evaluation should inform the analysis and design phases, not follow them. That means defining what success looks like before content is built, not after the budget has been spent and the project team has moved on.
Evaluation is also not a one-time event. It should be continuous, feeding insights back into the learning experience over time.
Three Buckets That Clarify Your Measurement Strategy
Drawing on TDRp and ISO 30437, the post offers a clean framework for organising what you measure:
Efficiency – usage, reach, completions, time spent. Most L&D teams are already here.
Effectiveness – knowledge, skill, confidence, assessment performance, pre/post comparisons. Many teams have some of this.
Outcome/Impact – connecting learning activity to business results: safety, compliance, productivity, retention. This is where the real value is, and where most teams still have work to do.
If you’re honest about which bucket most of your current reporting lives in, you’ll know where to focus next.
KPIs Make the Strategy Visible
A cybersecurity example in the post illustrates how a vague goal (“improve cybersecurity readiness”) becomes actionable when expressed as SMART KPIs. Once those KPIs are defined, the measurement strategy – and the dashboards that support it – becomes much clearer.
Dashboards, in this view, aren’t reports. They’re decision-making tools. An efficiency dashboard tells you whether learners are engaging. An effectiveness dashboard tells you whether they’re improving. An impact dashboard tells you whether the business is moving.
AI Can Help, But Data Quality Still Comes First
The post also touches on AI, which is impossible to avoid right now. The take is measured and practical: AI can help identify patterns, summarise trends, and support data storytelling — but it doesn’t replace a sound data strategy. Inconsistent or poorly structured xAPI data is still poor fuel, regardless of how sophisticated your analytics layer is.
Clean, conformant xAPI data in a well-configured LRS remains the foundation.
Read the Full Post
The Veracity blog post is thorough, practical, and grounded in the kind of real-world thinking that makes xAPI work in organisations rather than just on whiteboards.
You can also watch the full recording of the xAPI Collective presentation on YouTube.
Want to present at a future xAPI Collective session? Get in touch via Linkedin.